6.3.1. Alerts Section
Options to see Alert Trends
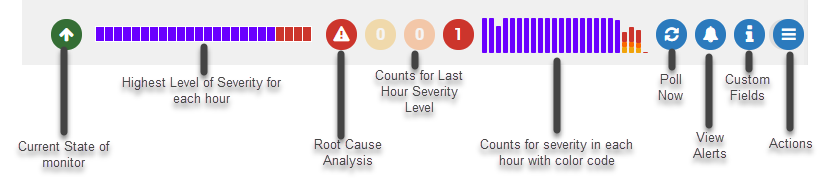
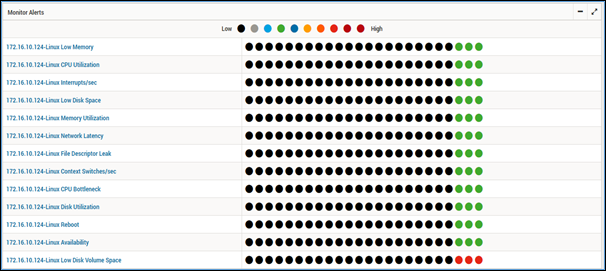
See the alert trend for quick analysis of monitor’s behavior in last 24 hours. Using the standard color codes of Motadata, the section shows the color of highest level severity in each hour. Starting from the left you’ll see:
Current state of monitor
Highest level of severity for each hour (of last 24 hours). Click on the bar to see the list of alerts triggered in that hour.
Root cause ananlysis to examine each alert in great detail.
Counts of the severity level for each color code. The count of severity is of current hour only.
Counts of the severity level for each hour in last 24 hours. The color of bar shows the highest level of severity for that hour.
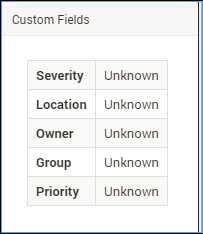
Root Cause Analysis: Click on the icon to drill-down on monitor health: this will launch Root-cause analysis details for selected monitor.
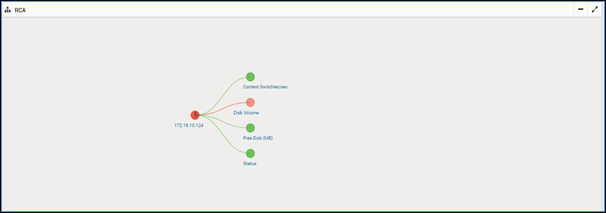
Root Cause Analysis
User can further see alert details with alert state.
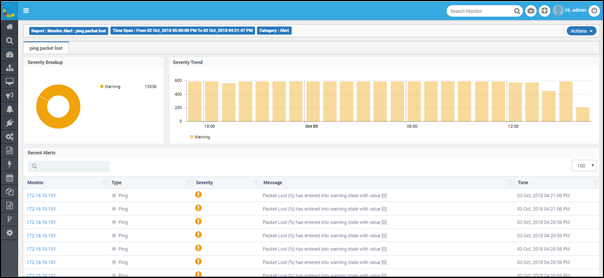
Alert Trends
Click no the alert name to view details of a particular alert that contains Alert’s Severity breakup, Severity Trend and Recent Alerts.
6.3.1.1. Poll Now
To refresh the information in the monitor’s dashboard, click on button. This will poll the fresh details of the selected monitor.
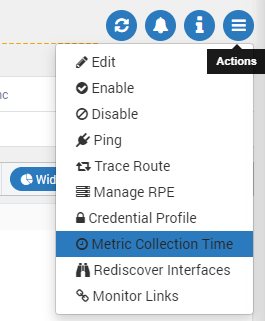
6.3.1.2. View Alerts
You can view which alerts are configured for the monitor by clicking on button.
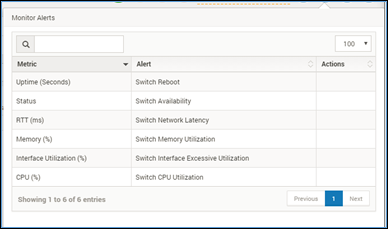
Alerts of Monitor